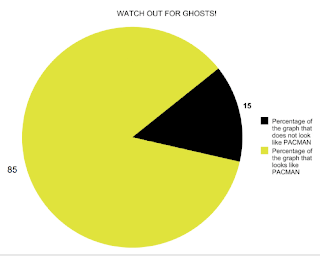
This always happens at report card time. I feel like I have been looking at pages full of numbers for days now! If only there was a way for me to visualize data in a more meaningful way... to turn those numbers in to easily understandable shapes...
Well, come to think of it , I can just use Create A Graph! This online graph maker lets me create Pie, Bar, Line, Area, and "XY" graphs... and I can even enter my own data, colors, and labels.
And just think about all of the uses... I could use it for weather, for studying elections, for looking at student opinions, examining M&M colors... in fact I guess I can turn almost any data into a graph!
http://nces.ed.gov/nceskids/createagraph/
Enjoy!

I love Create A Graph and so do the kids. You can let them play and create different shapes and colors without getting away from the concept.
ReplyDelete